Fully Booked Through 2026 • Now Considering 2027 Consulting Engagements • Open to Full-Time Consulting Engagements
📄 Case Study  ·  Retail & Loyalty Platform

From Spreadsheets
to Error Budgets

In 8 months I replaced a Finnish retailer's manual Excel process with an engineering-grade SLO program: error budgets, burn rate alerting, and a status page the business can read. All of it built on the observability tools they already owned.

#SLI #SLO #ErrorBudgets #BurnRateAlerting #Observability2.0 #SRE #Reliability
Before
  • Availability collected monthly by asking teams to self-report
  • No consistent definition of downtime or a failed request
  • Click-ops SLO experiments that never reached production
  • Every new service started reliability measurement from zero
  • Service health readable only by an engineer who knew where to look, and had access
  • No shared reliability targets across the Loyalty org
→
After
  • All 10+ services have SLOs defined in code and measured continuously
  • Defining an SLO is part of shipping a service, not a later project
  • One Splunk dashboard (Sliisloo) across CloudWatch, Dynatrace, Sentry, and synthetic monitors
  • No new observability platform introduced, and no added licence or operational footprint
  • Burn rate alerts wired to on-call, so the signal arrives before a breach, not after
  • Business status page: one rule, no engineer needed to interpret it
  • Workshops and fault injection baked in, so the team owns this independently

The instinct was right.
The tool couldn't keep up.

When I joined, the Loyalty platform team was already trying to track availability. Every month, team leads got the same question: "How much downtime did you have?" The answers went into a shared Excel sheet. They had the right instinct: measure reliability, report on it, hold teams accountable.

In practice, though, most teams had no idea how much downtime they'd actually had. Nothing measured it automatically, nobody shared a definition of what counted as a failure, and no one could compare services or spot a trend over time. A few engineers had experimented with click-ops SLO tooling, but none of it reached production scale.

When something went wrong, answering "is this service healthy?" meant tracking down the right engineer and asking them to read the dashboards. Nobody else could read the signal.

Three problems to solve at once

Technical fragmentation, organisational breadth, and a knowledge gap all needed to move together.

🔌

Fragmented observability stack

Teams used AWS CloudWatch, Dynatrace, and Splunk, each with its own SLO concept. Splunk users had built SLIs from log searches, which worked in principle but were fragile and inconsistent. No view across all of them existed.

📄

SLOs lived in tool UIs, not in code

Definitions weren't versioned, reviewable, or team-owned, so no one could answer "what changed, when, and why?" Click-ops also capped how precise an SLI could get: anything conditional, like a different latency threshold per endpoint, was impractical to maintain by hand.

⚠

Alert-everything culture

When shipping to production, teams added alerts on every metric they could think of. Noise was high. Burn rate alerting required a different mental model entirely.

🚩

Reliability was opaque to the business

Stakeholders and product managers had to ask an engineer to find out if a service was healthy. There was no self-serve signal, and no urgency to create one.

👥

Multiple teams, one program

The Loyalty platform spanned 10+ services across several product teams with different stacks, tooling, and working styles. Any rollout had to work for all of them.

🤔

Nobody had mapped the failure modes

Teams had stress-tested their services, but none of them had worked out how those services actually fail, what the observable symptoms look like, or whether their alerting would catch it.

Keep the report.
Rebuild the plumbing.

Excel is the default tech stack for anyone who needs to do some math. It's what you reach for first, and for a lot of jobs it's the right answer. The sheet the team had built asked a sound question and put every service's availability in one place.

It stopped fitting at everything around the math. A spreadsheet can't collect its own data, can't hold teams to one definition of a failed request, and can't fill itself in when the month gets busy. Those numbers were only ever as good as someone's recollection of a bad week.

So I kept the report and rebuilt the plumbing underneath it. In each phase below I swapped a manual step for real measurement, while keeping the questions the business already asked.

One constraint shaped all of it: don't grow the tooling footprint. The teams already had CloudWatch, Dynatrace, Sentry, Splunk and synthetic monitors, and none of it was going away. Rather than introduce another platform to own, I worked around the limits of what was already there and built only the components needed to make those tools serve SLOs. Nothing here asks the organisation to run one more thing.

SLOs in Code, Starting with CloudWatch

I started by getting SLO definitions out of tool UIs and into version control. I wrote a Terraform module that defines SLOs as code for AWS CloudWatch, the primary observability platform for most Loyalty services, and moved every definition into a central SLO monorepo: versioned, reviewable, team-owned.

That gave teams their first automated reliability data without asking them to change how they thought about their services yet.

Writing them in code also let me make the SLIs sharper than a tool UI allows. I made latency thresholds conditional within a single SLI definition, so what counts as a "good" event depends on the combination of HTTP method and API route. A GET on a read endpoint is held to a tight threshold; a POST on the same API that legitimately does more work gets its own. That gives one SLI and one error budget, with thresholds that match how each endpoint actually behaves, instead of a single loose number that hides read regressions or a tight one that cries wolf on every write.

This applies an Observability 2.0 instinct to SLOs. I keep the high-cardinality dimensions, method and route, inside the definition of a good event instead of flattening them into one pre-aggregated latency number and setting a single threshold on top. The SLI gets to be as specific as the system it measures.

Terraform SLO module SLO monorepo (GitOps) CloudWatch SLO definitions Per-route latency thresholds

Sliisloo: One View Across All Tools

With CloudWatch SLOs flowing, fragmentation became the next problem. CloudWatch, Dynatrace, and Splunk each showed only their own services, so I built a normalisation layer.

Sliisloo is the Splunk application I wrote for it, and it runs inside the Splunk the organisation was already paying for. It pulls 10-minute samples of SLO state into a shared index from CloudWatch, Dynatrace, Sentry, and synthetic monitors. For Splunk-native log-search SLOs I added a report that pushes records into the same index. One schema. One dashboard. Regardless of source.

Most of the work was in the seams. CloudWatch will hold an SLO object but won't show it next to anything else; Splunk will visualise anything you can get into an index but has no native concept of an SLO. Neither limitation was going to change, so Sliisloo is the set of small components that make one tool's output legible to the other. No new platform, no migration, no second place to look.

I applied the same Observability 2.0 principle at the platform level: one event store as the source of truth, with the status page, trends, and historical reporting all derived from it, instead of four tools each maintaining a partial picture nobody can reconcile.

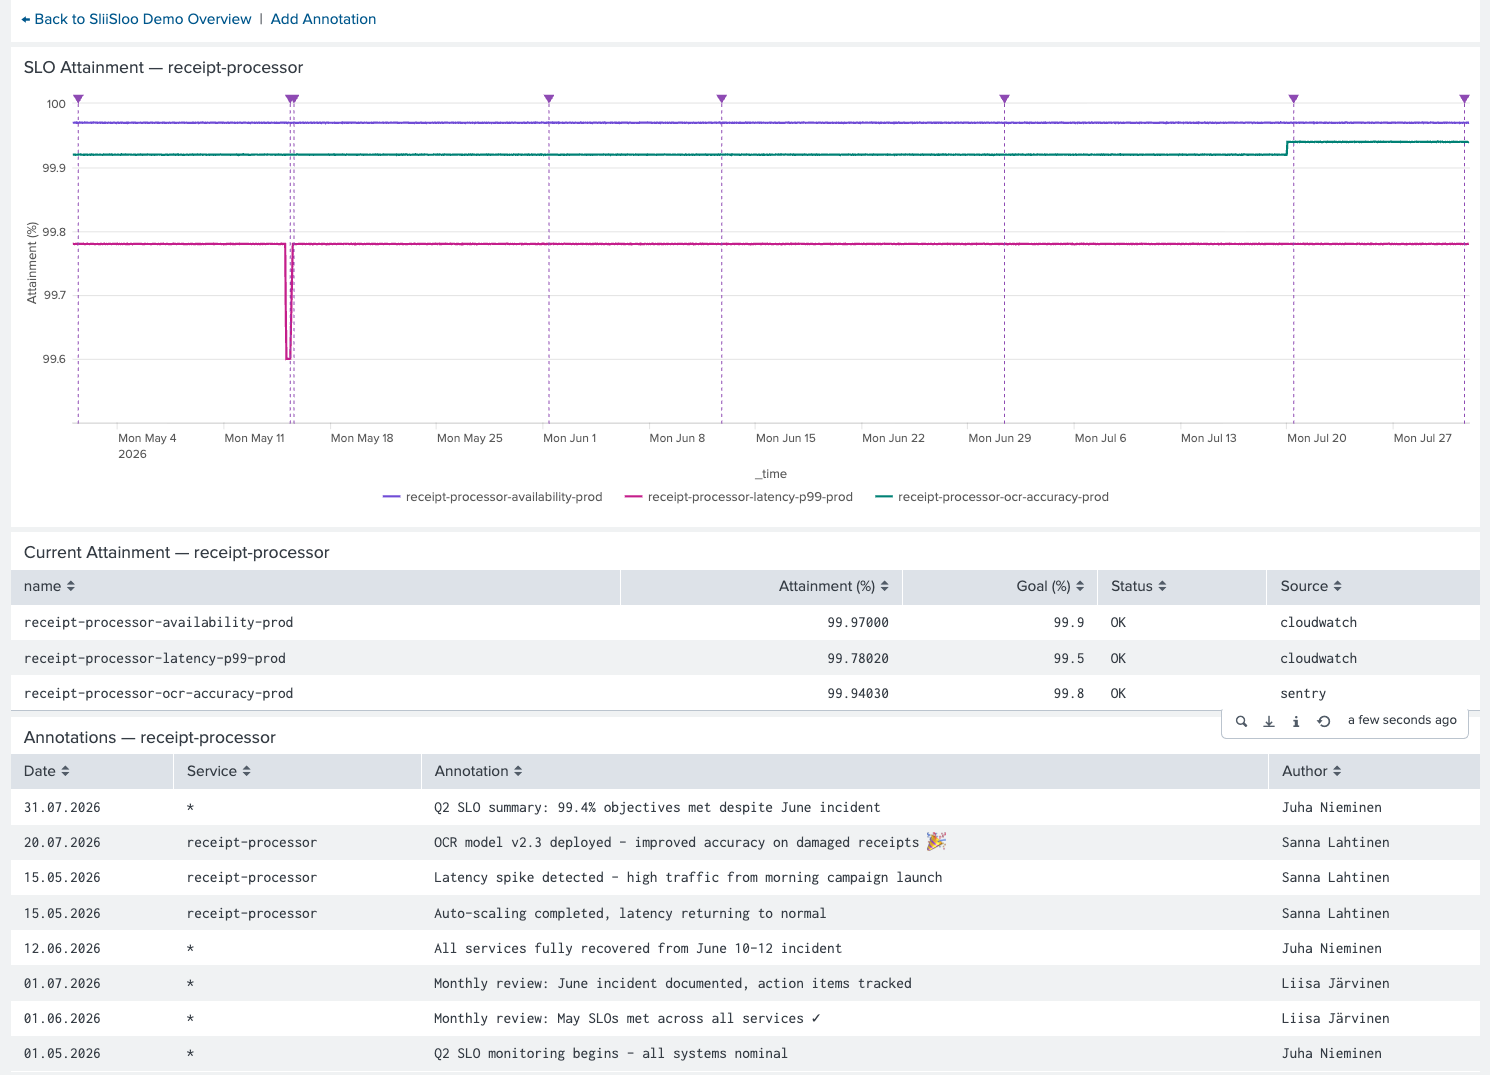
Beyond status and trends, I gave Sliisloo an annotations layer: engineers log what happened at any point on the SLO timeline, whether that is an incident, a deployment, or a campaign launch. The context lives alongside the data, so the chart tells the full story, not just the numbers.

The name came from the team, not from me. One of the Loyalty engineers coined Sliisloo (pronounced SlìSlò), a portmanteau that solved a genuine problem. I'm Czech, the team is Finnish, and saying "S-L-I, S-L-O" aloud in every meeting was a mouthful in either language. It stuck, and ended up an internal brand, stickers included.

I took that as a good sign. People don't nickname something they're merely tolerating, and by that point the team knew the concepts well enough to play with them.

Sliisloo Splunk app CloudWatch collector Dynatrace collector Sentry collector Synthetic monitor collector Annotations layer Week-over-week trends Historical reporting

Burn Rate Alerting + PagerDuty

With SLOs measured and visible, I made them actionable. I configured burn rate alerting for every service, so alerts fire when the error budget burns too fast, before a breach becomes inevitable. That replaced the alert-on-everything default with a signal that tells on-call engineers what actually matters. I wired PagerDuty in as the alerting destination to close the end-to-end on-call loop.

Burn rate alerting (all services) PagerDuty onboarding Error budget workflows

Workshops: Theory, Then Practice

Ahead of the live session I recorded a 17-minute video covering SLO fundamentals, error budget mechanics, and burn rate calculations, using examples from the Sliisloo dashboard. Engineers watched it at their own pace as preparation.

For the live workshop I wrote a fictional scenario: teams took a made-up service to production together, defining its SLIs and SLOs as a group exercise, and I facilitated the discussion afterwards. I built the format to stand on its own, so future engineers can work through the same video and workshop to onboard themselves, without me in the room.

17-min fundamentals video Hands-on scenario workshop Reusable for onboarding

Fault Injection Testing

With SLOs defined and alerting running, one question remained: does any of this actually work under failure? I set up fault injection testing on core Loyalty services, deliberately inducing failures to confirm the SLIs measured them accurately and the burn rate alerts fired as expected. Along the way we documented the failure symptoms the teams had never mapped.

Fault injection (core services) Alert verification Failure symptom mapping

Business Status Page

I built a service status page powered entirely by live SLO data. No manual updates. No engineer needed to interpret it. Leadership reads system health at a glance, and it feeds straight into wider business reporting.

SLO-powered status page Real-time, automated PowerBI integration (next)

SLOs as Default Practice

The shift that made the program stick wasn't a technical one. Putting an SLO on a new service still takes deliberate work. Someone writes the definition, picks the thresholds, opens the pull request. Nothing lands automatically. What changed is that nobody argues about whether to do it.

Before I started, measuring a new service meant building the measurement first: no module to call, no repository to add to, no agreed definition of a good event to borrow. That made an SLO easy to defer, and deferring it was the normal outcome. With the module and the monorepo in place, the work is small enough that skipping it is harder to justify than doing it.

So teams now treat an SLO as part of shipping a service rather than something to retrofit once it's already in production. That expectation is the durable outcome. The tooling only made it cheap enough to hold.

Expected on every new service Reusable module + monorepo Low-friction by design
💡 Design decision

One rule. No interpretation needed.

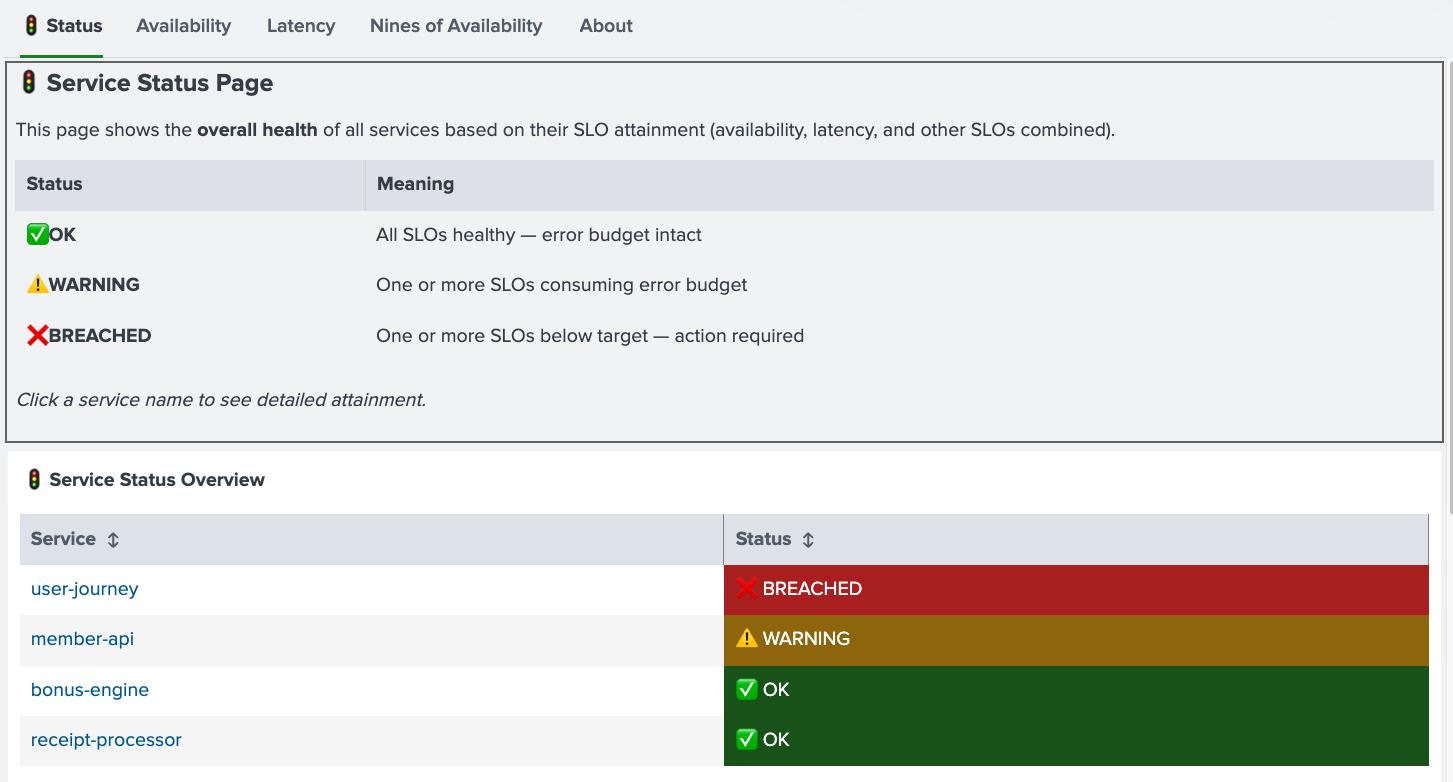
A service's status is its worst-performing SLO. That's the entire rule I built the status page on. It removes engineering judgement from reading system health, gives leadership an honest signal they can act on, and creates a forcing function: a weak SLO drags down the whole service state, which keeps SLO quality high over time.

What the team actually sees

These are the Sliisloo dashboards I built. In production they run on live SLO data, with no manual updates and no spreadsheets.

ⓘ

About these screenshots: the layouts, views, and functionality are exactly what I built, but the data is mocked. I replaced the service names, attainment figures, and statuses with representative sample values, so no customer metrics appear here.

Sliisloo › Status
Sliisloo service status page showing OK, WARNING and BREACHED states per service
Service Status Page. Each service gets a single traffic-light status, the worst of all its SLOs. OK means error budget intact. WARNING means it's burning. BREACHED means action required. Business stakeholders can read this without asking an engineer.
Sliisloo › Availability
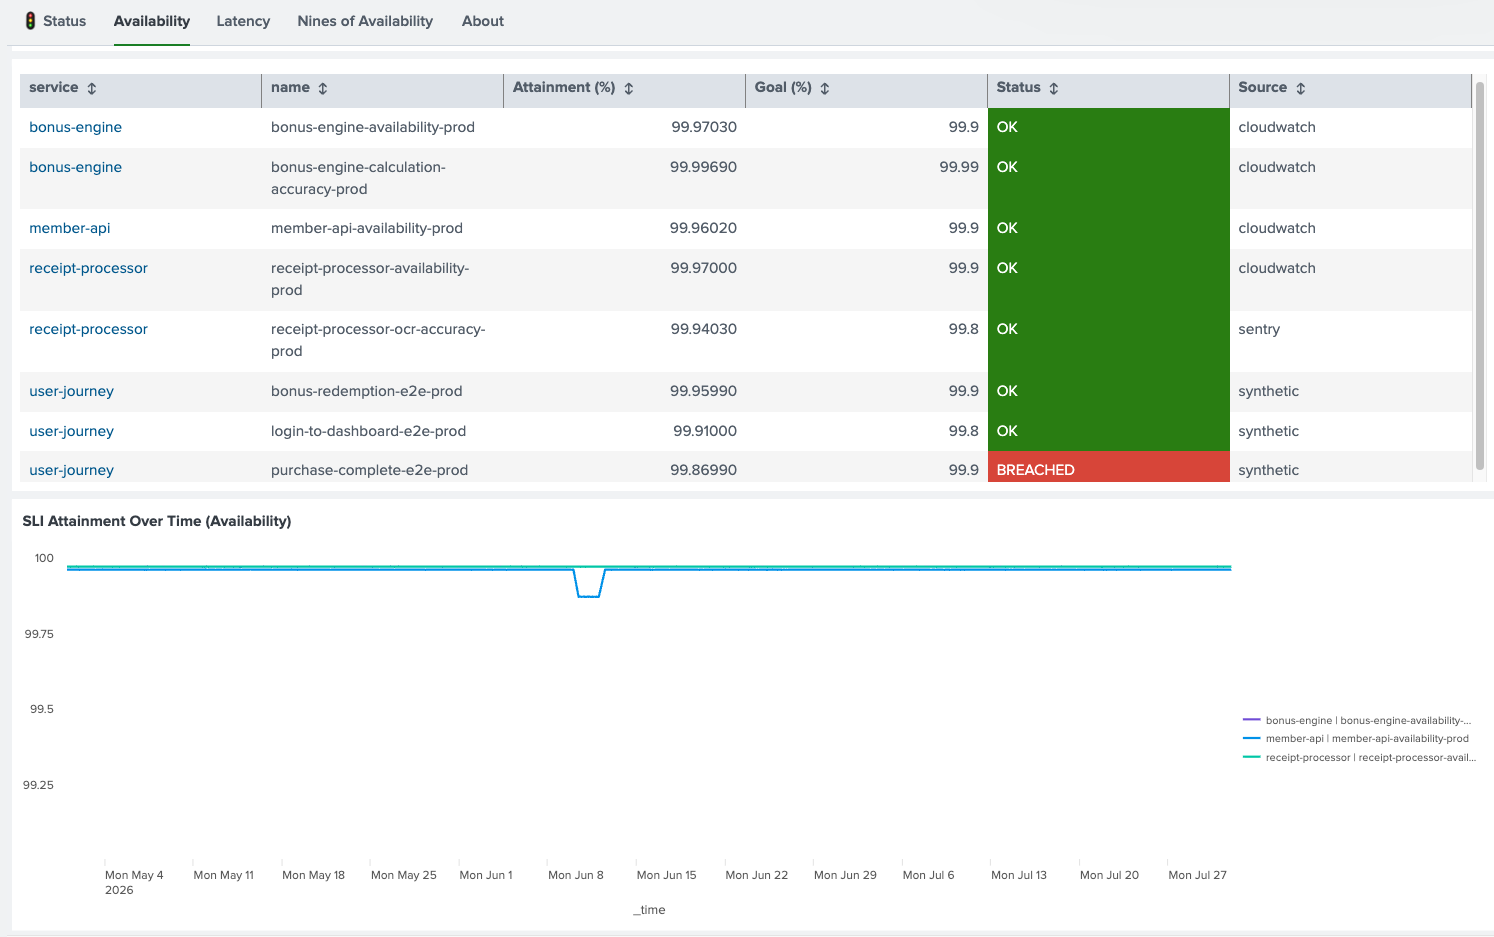
Sliisloo availability view showing SLO attainment across all services with trend chart
SLO Overview. Every SLO across all services in one table, with attainment %, goal, status, and source (CloudWatch, Dynatrace, Sentry, Synthetic). The trend chart below shows attainment over time so degradation is visible before it becomes a breach.
Sliisloo › receipt-processor
Individual service SLO view with attainment chart and annotations timeline
Individual Service View + Annotations. Each service has its own SLO chart with a full annotation timeline, where engineers log what happened, when, and why. Incidents, deployments, and improvements are visible right on the attainment graph, making the data tell the full story.

Nine delivered. One in progress.
All team-owned.

I designed every deliverable to outlast me. The team runs all of it independently now that the engagement has ended.

📄

Terraform SLO Module

CloudWatch SLOs defined as code, with latency thresholds that vary by HTTP method and route inside a single SLI. Reusable, versioned, reviewed like any other infrastructure change.

Foundation
📚

SLO Monorepo

Central GitOps repository as the single source of truth for all SLO definitions across the Loyalty platform.

Team-owned
⚙

SLOs as Default Practice

Putting an SLO on a new service is now part of shipping it, not a retrofit. It still takes deliberate work. The module and monorepo just made it cheap enough that teams stopped deferring it.

Cultural shift
📊

Sliisloo (Splunk App)

Unified SLO dashboard pulling from CloudWatch, Dynatrace, Sentry, synthetic monitors, and Splunk log-search SLOs. One view, regardless of source.

Built & deployed
⚡

Burn Rate Alerting

Running on all 10+ services. On-call engineers get a meaningful signal before a breach is inevitable, not after.

All services
🔔

PagerDuty Onboarding

Wired in as the alerting destination for burn rate alerts, closing the end-to-end on-call loop.

Integrated
🏫

Workshops

17-minute fundamentals video plus a hands-on fictional scenario workshop. Reusable for onboarding, with no external facilitation needed.

Self-serve
💣

Fault Injection Testing

I broke core services on purpose to verify SLI accuracy, confirm alert behaviour, and document failure symptoms.

Core services
🚩

Business Status Page

Live SLO-powered status page. Each service's health = its worst SLO. No manual updates, no engineer needed to read it.

Real-time

What the team said

“

Vítek was the missing link in the success of rolling out SLOs for the organisation.

Ops Lead, Loyalty Platform
“

The progress of observability improvements this year has been awesome.

Lead Engineer, Loyalty Platform

This case study covers the SLO program. Across the same 12 months I also worked on alert fatigue reduction, post-mortem facilitation, incident management coaching, engineering leadership, and FinOps. Each of those will get its own case study.

Ready to Define What
Reliable Means?

Whether you're starting from scratch or scaling up existing SLO work, let's talk.

Book a Discovery Call Send an Email